 |
India's Top 500 Companies 2016 |
|
||||||||||||||||||||||||||||||||||||||||||||||||||||||||||||||||||||||||||||||||||||||||||||||||
|
|||||||||||||||||||||||||||||||||||||||||||||||||||||||||||||||||||||||||||||||||||||||||||||||||||||||||||||||
Changing Face of Top 500 Companies
FY15 was a year of change for the Indian economy, with a new and stable government coming to power at the Centre. Towards the end of the year, the market reacted positively in anticipation of the change in administration. During the year, the Indian economy demonstrated resilience in a global environment that of rising financial stability risks and sluggish demand. Among the emerging economies that grappled with falling commodity prices, tight liquidity conditions and structural constraints, India saw some degree of easing of inflation and continuing fiscal consolidation. In FY15, Indias real GVA at basic prices grew by 7.1% over a 6.6% growth in FY14. The growth was driven by private consumption and supported by fixed investment. The Current Account Deficit to GDP ratio shrunk from 1.7% to 1.3% during the same period.
This section analyses the key performance aspects of Indias Top 500 companies across five editions of the publication, i.e. five financial years FY11 to FY15.
Total Income and Market Cap Reflect Healthy Growth over Past Five Editions
Over the past five editions of the Indias Top 500 Companies publication, the aggregate value of total income and average market capitalisation grew at a healthy CAGR of 9.2% and 10.6% per annum, respectively. As per the current 2016 edition of the publication, the aggregate total income and average market cap stood at ` 50,558 bn and ` 89,968 bn, respectively. The aggregate value of net profit, however, grew by a modest 4.7% per annum over the corresponding period. The subdued growth in profits is a reflection of the moderation that companies have been facing on their margins against a backdrop of subdued industrial activity, high consumer price inflation and interest rates, sluggishness in the services sector, weakening private consumption and investment demand. This is evident through the fact that there were 32 loss-making companies in FY14 and 39 in FY15.

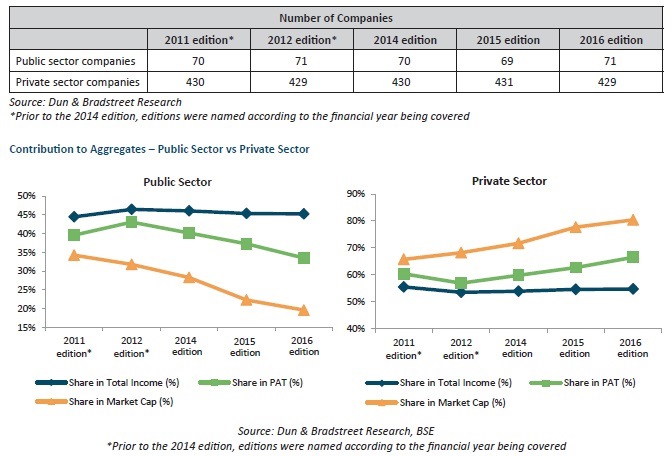
Increasing Prominence of Private Sector Companies
The number of public sector companies appearing in the last five editions of the Indias Top 500 Companies publication has largely remained unchanged. However, their contribution to the aggregate value of certain parameters has declined over the same period. For instance, the contribution of PSUs in the aggregate market capitalisation of the set of companies constituting Indias Top 500 Companies declined sharply from 34.3% in the 2011 edition to as low as 19.6% in the current 2016 edition, while their share in the aggregate value of net profit declined from 39.6% to 33.5% over the same period. Nevertheless, it is a noteworthy fact that the public sector, which accounts for merely 14% of the universe of Top 500 Companies, contributes to around 40% of the aggregate total income and PAT.
The share of private companies in the aggregate market capitalisation of Indias Top 500 Companies increased from 65.7% in the 2011 edition to a phenomenal 80.4% in the 2016 edition. Private sector companies share in the aggregate net profit increased from 60.4% in the 2011 edition to 66.5% in the 2016 edition. Their share in the aggregate total income, however, has largely remained range-bound at around 55%.Ownership-wise Composition
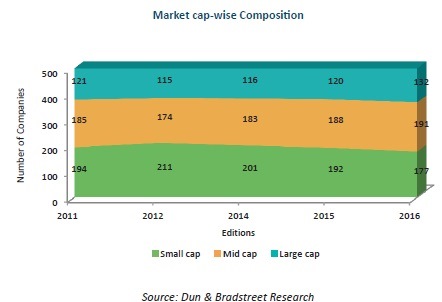
Gradual Progression of Small Cap Companies to Mid and Large Cap
For the purpose of analysis, the set of companies constituting Indias Top 500 Companies has been segregated on the basis of their market cap viz; large-cap, mid-cap, and small-cap, based on the widely used 80:15:5 principle, basis the average market capitalisation. In terms of market capwise composition, small cap companies have historically had the largest representation among Indias Top 500 Companies. However, it is noteworthy that the number of small cap companies has been steadily declining over the years. Over the past five editions of the Indias Top 500 Companies publication, the number of small cap companies has declined from 194 companies in the 2011 edition to 177 in the 2016 edition. In contrast, the number of mid cap companies has risen from 185 in the 2011 edition to 191 in the current edition, and the number of large companies has increased from 121 to 132 during the same period. This trend indicates the progression of companies to higher levels in terms of market cap.
Healthy growth in Market Capitalisation of Top 500 Companies
Over the past five editions of the Indias Top 500 Companies publication from 2011 to 2016, the aggregate value of the average market capitalisation grew at a CAGR of 10.6%. Interestingly, the aggregate average market capitalisation had witnessed a 7.6% decline in FY12 (2012 edition), which can be attributed to concerns about macroeconomic issues like high inflation, high interest rates, a depreciating rupee and policy uncertainties. However, from that period onwards, the average market capitalisation bounced back in subsequent editions.
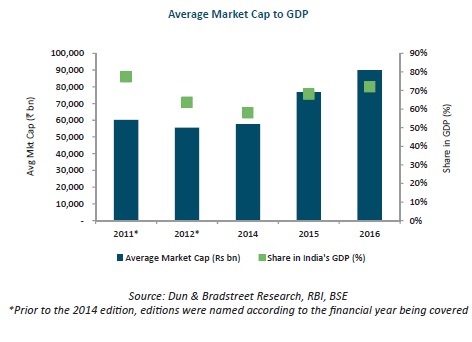
During FY14 (2015 edition), the aggregate value of the average market capitalisation of the Top 500 companies jumped by a sharp 33.1% to ` 76,806 bn, in the wake of improved scenario of global financial markets and exchange rate adjustments, policy measures and anticipation of electoral outcomes in the domestic scenario.
The 2016 edition (FY15) also saw a sharp rise in the aggregate average market capitalisation to ` 89,968 bn (17.1% rise), which can be perceived as a positive response to a stable government at the centre, a series of long-pending policy reforms and several other proactive steps taken to improve governance and simplify procedures. The share of the aggregate average market capitalisation of the Top 500 companies as per the 2016 edition stands at 72% of Indias GDP at market prices (base year 2011-12).
Service Sectors Play Dominant Role in Driving Market Cap Growth
The companies constituting the set of 500 companies featuring in the 2016 edition of the Indias Top 500 Companies publication have been categorised into 55 sectors (including the residual others category). Of the top 10 sectors contributing to the aggregate market capitalisation, service sectors, namely Banks, Software and ITeS and FIs/NBFCs/Financial Services feature among the top four. In the 2016 edition (FY15), these three sectors together account for 31.8% of the aggregate value of average market cap, 38.8% of the aggregate net profit, and about 26.9% of the aggregate total income. In the 2011 edition (FY11), their contribution to the aggregate values of average market cap, net profit and total income stood at 26%, 30% and 19.5%, respectively. According to the table below, these sectors reflect a healthy CAGR in terms of growth in all three parameters (except for banks net profits).
Most Valuable Sectors of Top 500 2016* (% share in aggregate)
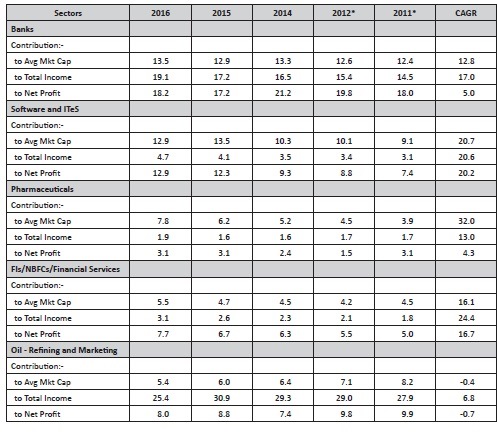
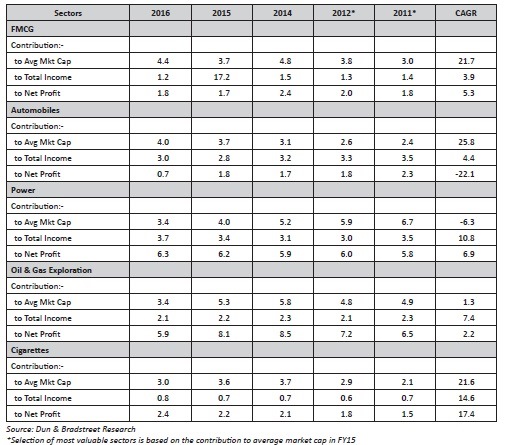
The market cap of the pharmaceuticals sector grew at a rate of 32% per annum over five editions and its share in the aggregate market cap doubled from 3.9% in the 2011 edition to 7.8% in the current one. On the other hand, although the Oil Refining and Marketing sector continued to account for more than onefourth of the aggregate total income, it reflected a decline in both, market cap as well as net profits over the corresponding period. The FMCG and Automobiles sectors reported a healthy 20-25% growth per annum in their average market cap during this period, although the latters net profits fell to less than 40% of the value reported in FY11. The cigarettes sector exhibited a healthy CAGR growth in all parameters.
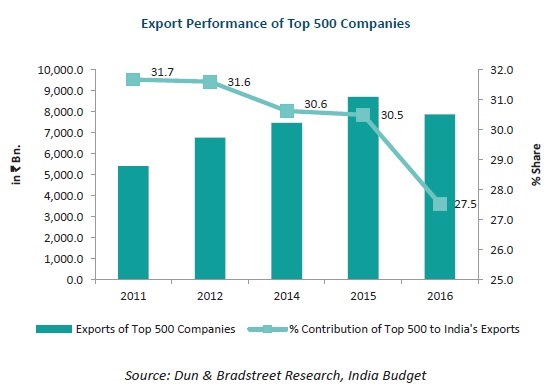
Share of Top 500 Companies in Indias Overall Exports Contracts in FY15
In all the past editions (barring the 2009 edition), the share of Dun & Bradstreets list of Indias Top 500 companies in the countrys overall exports consistently stood at over 30%. In FY15 (2016 edition), however, their share contracted to 27.5%. Amongst the Top 500 companies, the sector that witnessed the steepest decline in exports was Oil Refining & Marketing. This was largely due to a steep fall in global oil prices. Other sectors that reported a sharp decline in exports were Oil & Gas Exploration, Engineering Projects/ Capital Goods, Food Products and Iron & Steel.
Between the 2011 and 2016 editions of the publication, Indias overall exports grew at a CAGR of 13.7%, while the exports of Top 500 companies grew by a slower 9.8% per annum.
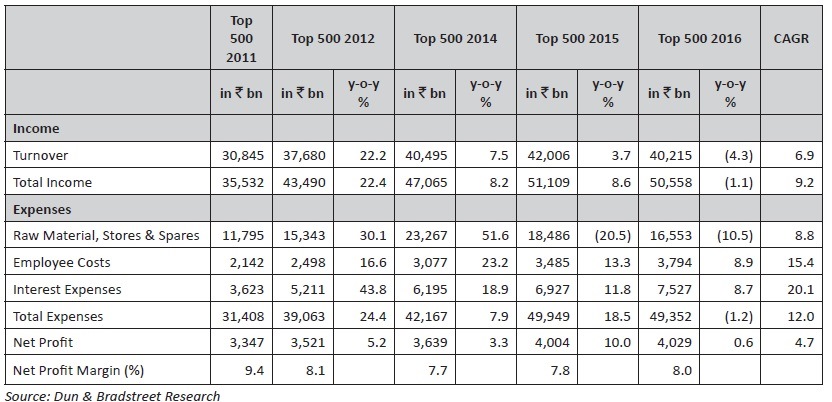
Rising Interest Expenses Dent Margins
In line with overall industry trends, the margins of Top 500 companies have contracted over the past five editions. The profit margin calculated on the basis of the collective total income and net profit of all Top 500 companies taken together contracted from more than 9% in FY11 (2011 edition) to less than 8% in FY15. Over the past five editions, net profit of Top 500 companies has grown at a modest CAGR of 4.7% per annum, in spite of a faster 9.2% per annum growth in total income. The major expense head is raw materials, stores & spares (33-36% of total income), which rose at 8.8% per annum. Interestingly, raw material expenses reflected a decline of 20.5% and 10.5% in FY14 and FY15, respectively. On the other hand, employee costs and interest expenses rose by a sharp 15.4% per annum and 20.1% per annum, respectively, over the past five editions. Interest expenses, in particular, have risen rapidly over the past five editions, with their proportion in total expenses expanding from 11.5% in the 2011 edition to 15.3% in the 2016 edition.
Financial Performance of Top 500 Companies
Software & ITeS Sector Emerges as Top Equity Dividend Paying Sector
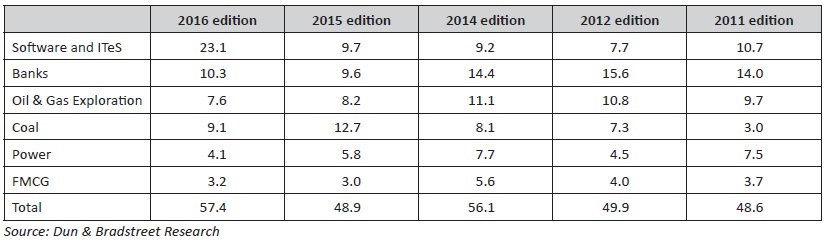
In the past five editions of the Indias Top 500 Companies publication, the Banks, Oil & Gas Exploration, Software & ITeS, Coal, Power and FMCG sectors have been the highest contributors in terms of payment of equity dividend among Top 500 companies. In the 2016 edition (FY15), the Software & ITeS sector emerged as the topmost sector in terms of equity dividend payment with a share of 23.1%. Banks (10.3%) and Oil & Gas Exploration (7.6%) also contributed significantly. The top six sectors collectively paid 57.4% of the total equity dividend paid by Top 500 companies during the year.
Contribution of Top Equity Dividend Paying Sectors to Total Dividend of Top 500 Companies (%)
147 Companies have Featured in all Editions of Indias Top 500 Companies Publication Series
The 2016 edition of Dun & Bradstreets premier publication Indias Top 500 Companies includes 147 companies which have featured in all editions thus far. It is only apt to label these companies as consistent performers, considering the fact that they have been able to sustain their position over the years, amid tough competition.
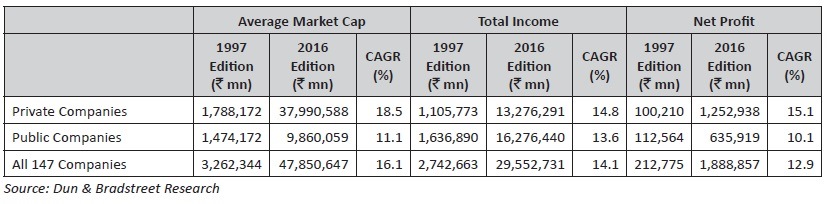
The set of 147 companies that has been consistently featuring in Dun & Bradstreets Top 500 publication accounted for a phenomenal 71.2% of the aggregate market capitalisation and almost 70% of the aggregate values of total income and net profit in the 1997 edition. By the 2016 edition, however, their share in all three parameters contracted to 53.2% of the aggregate market capitalisation, 58.5% of the aggregate total income and 46.9% of the aggregate net profit. Notwithstanding the decline in contribution, these 147 companies have still managed to hold onto a lions share among the universe of Top 500 Companies. These 147 companies have grown consistently over the years. They recorded a CAGR of 16.1% in market capitalisation, 14.1% in aggregate total income and 12.9% in aggregate net profit between the 1997 and 2016 editions of the Indias Top 500 Companies publication.
Of these 147 companies, 32 are PSUs and 115 are private companies. The PSUs among these 147 companies grew at a healthy rate of 13.6% per annum in terms of collective total income and around 10-11% per annum in terms of aggregate market capitalisation and net profit. Private companies, however, grew faster, recording an 18.5% per annum growth in terms of aggregate average market capitalisation and 14-15% per annum growth in total income and net profit.
Comparative Analysis of 147 Consistently Featuring Companies