 |
India's Top 500 Companies 2016 |
|
||||||||||||||||||||||||||||||||||||||||||||||||||||||||||||||||||||||||||||||||||||||||||||||||

|
|||||||||||||||||||||||||||||||||||||||||||||||||||||||||||||||||||||||||||||||||||||||||||||||||||||||||||||||
|
|||||||||||||||||||||||||||||||||||||||||||||||||||||||||||||||||||||||||||||||||||||||||||||||||||||||||||||||
Non-Banking Financial Companies
Key Highlights
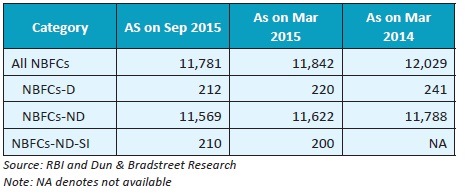
The total number of NBFCs registered with the RBI stood at to 11,781 which includes 212 NBFCs-D companies and 11,569 NBFCs-ND companies as on end-Sep 2015.
Share of NBFC assets as a percentage of scheduled commercial banks assets has increased from 7% in 1998 to 14.8% in March 2015.
Borrowings from banks and FIs accounted for 46.4% and debentures accounted for 33.4% of the total borrowings of NBFCs-D in FY15. In case of NBFCs-NDSI, debentures accounted for 48.7% and borrowings from banks and FIs accounted for 24.9% of the total borrowings.
In FY15, the aggregated balance sheet of the NBFC
sector expanded by 16.8% y-o-y to  14,565 bn and
14.2% y-o-y in Sep 2015 as compared to Mar 2015.
14,565 bn and
14.2% y-o-y in Sep 2015 as compared to Mar 2015.
As at the end of FY14 balance sheet size of NBFC-D
stood at 1,925 bn registering a marginal increase of
around 2% y-o-y. The balance sheet size of NBFCs-ND-SI
grew considerably by 15.9% y-o-y and stood at 14,166
bn as at end-Mar 2015.
The aggregate total income of the NBFC sector
expanded by 15.7% y-o-y to 1,676 bn in FY15 and net
profit to total income increased from 18.3% in FY14 to
18.8% in FY15.
During FY15, total income of NBFCs-D grew by 13.4%
to 246 bn while their net profit declined substantially
by 35% to 28 bn. NBFCs-ND-SI, on the other hand
showed an improved performance and their total
income and net profit increased 15.6% and 15.8%
respectively to stand at 1,601 bn and 297 bn
respectively in FY15.
CRAR of the NBFCs-ND-SI slipped from 27.8% as of Sep 2014 to 27.3% as of Mar 2015 and to 23.8% as of Sep 2015.
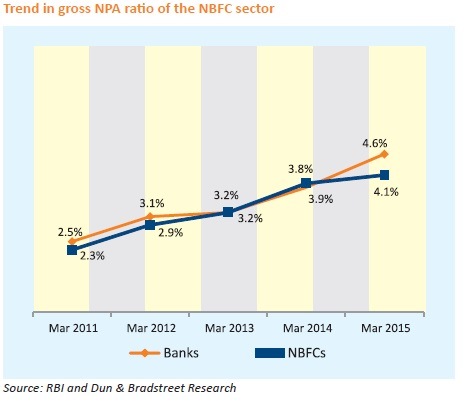
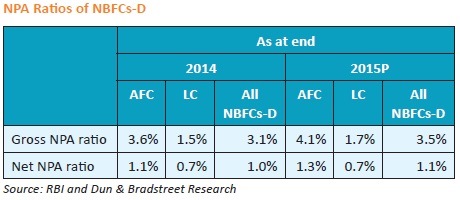
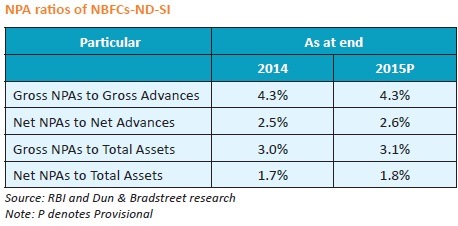
Gross NPAs as percent of credit deployed of NBFC sector rose to 4.1% as on end-Mar 2015 from 3.9% as on end-Mar 2014. The asset quality of the NBFCs-D and NBFCs-ND-SI deteriorated from the past years level. During FY15, gross NPA to gross advances of NBFC-D increased to 3.5% as against 3.1% in FY14. At the same time, net NPAs to net advances also increased to 1.1% compared to 1% in FY14. In case of NBFC-ND-SI, net NPA ratio increased from 2.5% in FY14 to 2.6% in FY15.
The number of NBFCs registered with the RBI continues to decline led by consolidation in the sector
The total number of NBFCs registered with the RBI declined marginally to 11,781 as on end-Sep 2015 from 11,842 as on end-Mar 2015 and 12,029 as on end-Mar 2014. This reduction in numbers is largely due to consolidation in industry and cancellation of Certificates of Registration (CoR). Of the total 11,781 NBFCs, 212 were deposit-accepting (NBFCs-D) and 11,569 were non-deposit accepting (NBFCs-ND).
Since Nov 2014, NBFCs-ND with assets of 5 bn and above
have been classified as systemically important non-deposit
accepting NBFCs (NBFCs-ND-SI).
During the period Mar - Sep 2015, 10 more companies came under the category of NBFCs-ND-SI taking the total count to 210 as on Sep 2015.
Distribution of NBFCs registered with RBI
Share of NBFC assets as a percentage of scheduled commercial banks assets has increased from 7% in 1998 to 14.8% in March 2015. However, share of NBFC deposits as a percentage of scheduled commercial banks deposits has come down from 3.34% in March 1997 to 0.30% in March 2015.
The non-banking financial sector is witnessing consolidation as the number of NBFCs operating in the economy is declining. A Committee on Comprehensive Financial Services for Small Business and Low Income Households which was set up by RBI also came up with the recommendation of consolidation of multiple NBFC definitions into two categories viz. (i) core investment companies and (ii) all other NBFCs along with activity based regulations.
Debentures and Borrowings from banks & FIs continues to be the two most important sources of funds for NBFCs-D and NBFCs- ND-SI
Funding source of NBFCs comprises of debentures, borrowings from banks and FIs, public deposits, commercial papers and inter-corporate loans. In FY15, borrowings from banks and FIs, followed by debentures, constituted an important source of funds for NBFCs-D. Borrowings from banks and FIs accounted for 46.4% and debentures accounted for 33.4% of the total borrowings of NBFCs-D in FY15. In case of NBFCs-ND-SI, debentures form an important source of funds followed by borrowings from banks and FIs. In FY15, debentures accounted for 48.7% and borrowings from banks and FIs accounted for 24.9% of the total borrowings of NBFCs-ND-SI.
Consolidated balance sheet of the NBFC sector
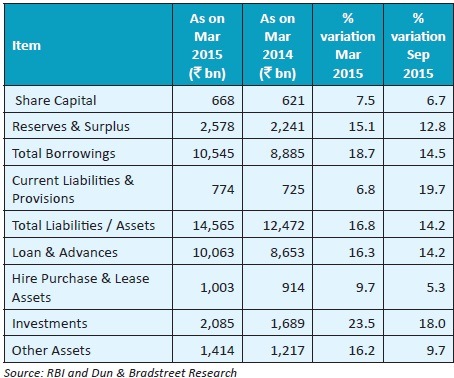
In FY15, the aggregated balance sheet of the NBFC sector
expanded by 16.8% y-o-y to 14,565 bn and 14.2% y-o-y
in Sep 2015 as compared to Mar 2015. Total borrowing
which accounted for more than two-third of the total
liabilities increased 18.7% y-o-y in FY15 and 14.5% y-o-y in
Sep 2015.
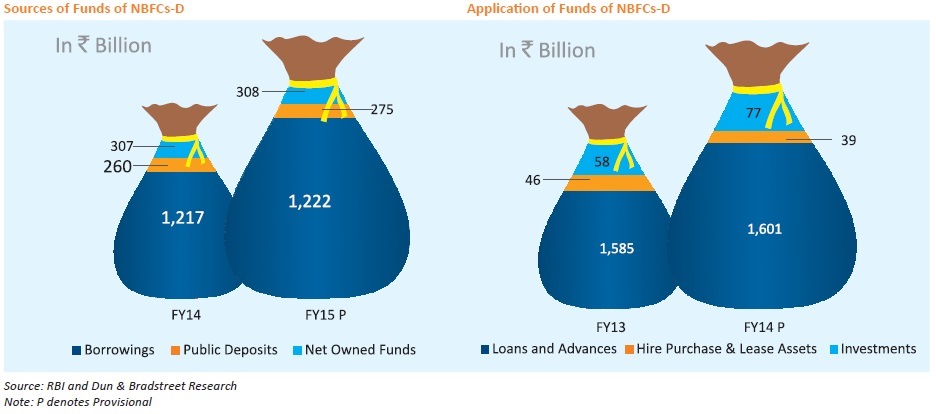
As at the end of FY15 balance sheet size of NBFC-D
expanded by 2% to stand at 1,925 bn. Component wise,
the advances accounted for a predominant share of the
total assets, followed by cash and bank balances. On the
liability side, the expansion was mainly in terms of public
deposits which are subjected to credit rating, and bank
borrowings which continue to constitute the largest source
of funding for NBFCs-D. In FY15, Both public deposits and
bank borrowings grew 5.8% y-o-y. Borrowings through
commercial papers which picked up significantly by 55.6% in
FY14, declined considerably by 16.6% during the year while
inter-corporate borrowings grew considerably by 32.7%
during FY15. Mobilisation of funds through debentures,
which constituted the second biggest source of funding,
declined 2% during the year.
In FY15, loans and advances grew marginally by 1% but hire
purchase & lease assets decreased considerably by 15.2%
y-o-y. Investment activities of NBFCs-D witnessed a sharp
rise during the year. Total Investments grew significantly at
32.8% to 77 bn mainly on the back of substantial growth
in investments in commercial paper, mutual funds and
debentures & bonds. The ratio of public deposit to net
owned funds improved marginally and stood at 89.3% as at
end-March 2015, as against 84.7% as at end-March 2014.

During FY15, the balance sheet of NBFCs-ND-SI expanded
significantly at 15.9% to 14,166 bn on the back of marked
growth in disbursement of loans and advances on the asset
side and sharp rise in borrowings on the liability side. Total
borrowings of NBFCs-ND-SI which represents more than 70%
of their total liabilities grew 17.4% y-o-y in FY15. Secured
borrowing which constitutes a major source of borrowings
for NBFCs-ND-SI grew by 16.8% during FY15 on account of
15.2% growth in borrowing through debentures and 9.5%
growth in bank borrowings. Unsecured borrowings which
constitute 45% of total borrowings also grew 18% y-o-y
during the year. Secured and unsecured borrowings from
FIs both declined significantly by 11% and 45% respectively
during FY15.
On the deployment side, loans and advances continue to constitute the largest share, followed by investments and hire purchase assets. Loans and advances extended by NBFCs-ND-SI posted significant growth at 15.5% in FY15 owing to the strong growth in credit extended by NBFC - Infrastructure finance companies, microfinance companies and loan companies. Among the sectors, infrastructure, medium and large-scale industries, and the transport sectors contributed to strong growth in credit off-take of the NBFCs-ND-SI in FY15. During FY15, hire purchase assets and investments grew 10% and 20% y-o-y respectively.
Financial Performance of NBFCs
In FY15, the aggregate total income of the NBFC sector
expanded by 15.7% y-o-y to 1,676 bn. The NPM increased
from 18.3% in FY14 to 18.8% in FY15. However, it deteriorated
to 15% during the quarter ended Sept 2015 as compared to
Mar 2015. RoA of the NBFC sector declined to 2.2% as of Mar 2015 and further to 1% as of Sep 2015.
In FY15, total income of NBFCs-D grew by 13.4% to 246
bn and expenditure grew by 14% to 189 bn. The net profit
decline during FY15 may be attributed to increased interest
payment burden and higher operating expenses. Owing to
the decline in net profit, RoA of NBFCs-D also deteriorated
from previous years level at 2.3% to 1.5% in the current
year. In view of increased costs, cost-to- income ratio of the
NBFCs-D also rose from 76.4 to 77 during the year.
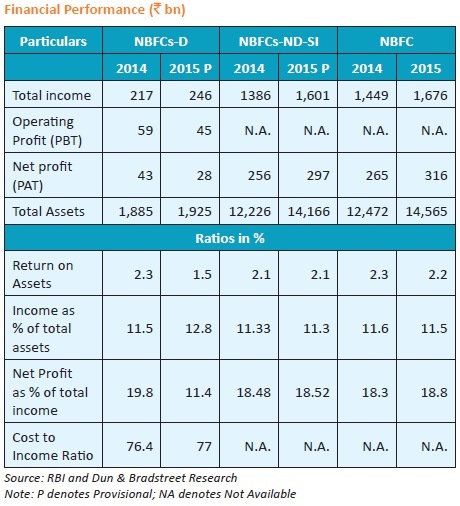
Total income of NBFCs-ND-SI grew 15.6% to 1,601 bn and
expenditure increased by 15.54% to 1,187 bn. As a result
net profit of NBFCs-ND-SI grew by 15.8% to 297 bn in FY15.
NPM remained in double digits and increased marginally
from last years level. RoA remained at the same level of
2.1% during the year.
NBFCs-ND-SI and NBFCs-D companies shall maintain Tier I capital of 10% by end of Mar 2017 and shall follow 90 day norm for classification of assets
NBFCs-D and NBFCs-ND-SI are required to maintain minimum Capital Adequacy Ratio (CRAR) of 15% as against 9% in case of banks. As per the revised guidelines issued by RBI in Nov 2014, all NBFCs-ND-SI and NBFCs-D companies shall maintain minimum Tier l capital of 10%. These entities have to meet the compliance in a phased manner which is 8.5% by end-Mar 2016 and 10% by end-Mar 2017.
As of Mar 2015, the capital adequacy position of the NBFCs-ND-SI remained comfortable and was well above prudential norms. Nevertheless, CRAR of the NBFCs-ND-SI slipped marginally from 27.8% as of Sep 2014 to 27.3% as of Mar 2015 and further to 23.8% as of Sep 2015. At the disaggregated level, eights NBFCs were unable to meet the regulatory required minimum CRAR of 15% as of Sep 2015.
To align the asset classification norms applicable to NBFCs with the 90 day norms currently applicable to banks, RBI has issued revised regulatory guidelines for classifying the assets as NPAs. As per the revised regulations, NBFCs-ND-SI and NBFCs-D shall meet the compliance of classifying an account as NPA in a phased manner which is lease rental and hirepurchase assets shall become NPA if they become overdue for 9 months for end-Mar 2016, overdue for 6 months for end-Mar 2017 and overdue for 3 months for end-Mar 2018. Similarly, assets other than lease rentals and hire-purchase assets shall become NPA if they become overdue for 5 months for end-Mar 2016, overdue for 4 months for end- Mar 2017 and overdue for 3 months for end-Mar 2018. RBI has also increased the provisioning for standard assets in a phased manner from 0.25% to 0.40% of the outstanding amount for NBFCs-D and NBFCs-ND-SI.
In recent years, asset quality of NBFC sector has been impacted due to slowdown in the economy. Gross NPAs as a percent of credit deployed rose to 4.1% as on end-Mar 2015 from 3.9% as on end-Mar 2014.
Asset quality of NBFCs-D deteriorated as both gross and net NPAs increased during FY15. Gross NPA to gross advances of NBFC-D increased to 3.5% as against 3.1% in FY14. At the same time, net NPAs to net advances also increased to 1.1% compared to 1% in FY14. Category-wise, deterioration in asset quality was more in respect of the Asset finance companies (AFCs) as compared to the Loan companies (LCs).
Asset quality of NBFCs-ND-SI also continued to deteriorate and the NPA ratio rose marginally as compared to the previous year. Net NPA ratio increased from 2.5% as at end- Mar 2014 to 2.6% as at end-Mar 2015. Amongst the NBFCs- ND-SI, LCs accounted for the major chunk of NPAs followed by NBFC-Infrastructure Finance Companies and AFCs as at end-Mar 2015. The asset quality of the NBFC-Micro Finance Institutions witnessed some improvement albeit it still remained at an elevated level. NPAs of the NBFCs-ND-SI sector were primarily concentrated in infrastructure sector and transport operator segment.
Regulatory Developments for NBFCs
The role of NBFC sector in the Indian financial system has become critical in terms of its size, spread and niche areas of operations. Majority of large players in the NBFC sector have grown bigger and become more connected with other financial entities, necessitating periodical review of the regulatory framework for this sector. With a view to address the regulatory gaps, arbitrage and risks associated with NBFCs, during the year, the RBI initiated a host of measures to strengthen regulation and supervision of NBFCs and harmonize their regulations with those of the banks in a phased manner as also to foster financial stability. Some of these include:
10 mn by Mar 2016 and 20 mn by Mar 2017;
rating requirement for all unrated deposit-taking AFCs
by Mar 31, 2016 for being eligible for acceptance of
public deposits; fixing of threshold of 5 bn for all the
NBFCs-ND for being considered systemically important,
and harmonisation of the asset classification norms for
NBFCs-ND-SI and NBFCs-D in line with that of banks, in
a phased manner. 5 bn and
above, have been proposed to be brought under the
Securitization and Reconstruction of Financial Assets
and Enforcement of Security Interest Act, 2002.Outlook
NBFCs that form a significant segment of the shadow banking system play an important role in broadening access to financial services and enhancing competition and diversification of the financial sector. In medium-term different segments of the NBFC sector are poised to have different prospects and challenges. For example, investment companies are expected to have bright prospects, due to expansion in the equity and corporate bond markets, along with economic growth and careful recalibration of bank finance in the wake of Basle III. The infrastructure NBFCs will have greater scope in the coming years, both because the economic growth will bring forth new projects and banks, will adopt a restrained approach towards such projects. As the large exposure regime for the banks will apply by 2018, NBFCs will have space for market funding or loan funding of big corporate financing in the medium term.
Financial Institutions (FIs)
Key Highlights
1,147.4 bn and 1,029.1 bn
respectively, registering a y-o-y growth of 16.7% and
11.8% respectively. 350.1
bn owing to low growth in interest income and decline
in non-interest income. 52.9 bn and 78.3 bn respectively.Financial assistance by all FIs increased decently in FY15
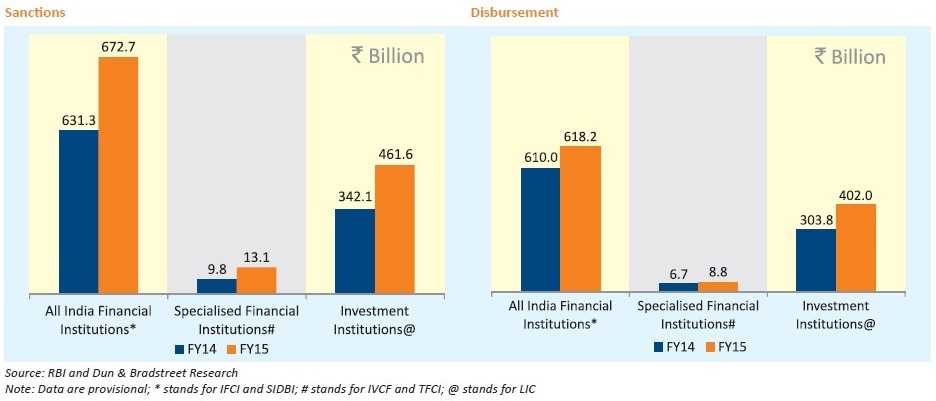
Sanctions and disbursements made by all FIs as at the end
of FY15 stood at 1,147.4 bn and 1,029.1 bn respectively,
registering a y-o-y growth of 16.7% and 11.8% respectively.
This growth was led by 33.4% and 34.9% growth in sanction
and 32.5% and 32.3% growth in disbursements of specialised
financial institutions and investment institutions respectively.
Contribution of both specialized FIs and investment
institutions in overall FIs sanctions increased to 1.1% and
40.2% respectively and contribution in disbursement to 0.9%
and 39.1% respectively in FY15. During the year, sanctions
and disbursement of all India financial institutions consisting
of IFCI and SIDBI increased marginally by 6.6% and 1.3%
respectively. Their contribution in overall FIs sanctions and
disbursement however went down to 58.6% and 60.1% in
FY15 from 64.2% and 66.3% in FY14 respectively.
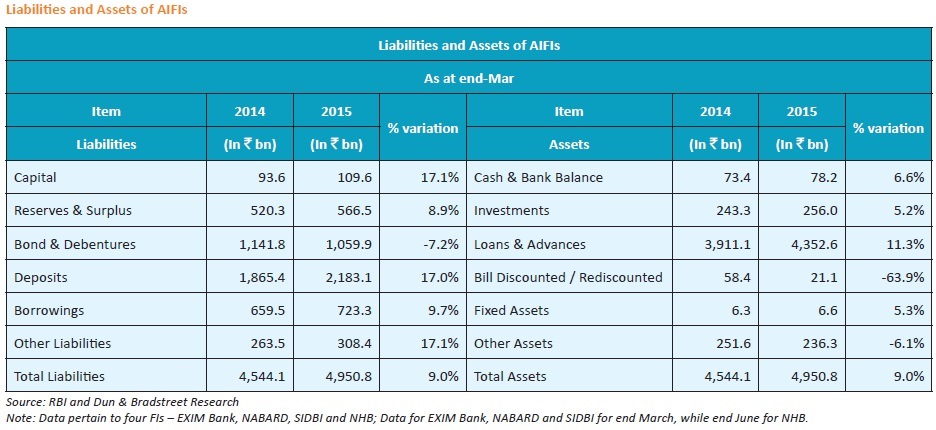
Balance sheet performance of All India financial institutions (AIFIs)
Presently, there are four all India financial institutions regulated and supervised by the Reserve Bank of India. These are Export-Import Bank of India (EXIM Bank), National Bank for Agriculture and Rural Development (NABARD), National Housing Bank (NHB) and Small Industries Development Bank of India (SIDBI). These AIFIs play a salutary role in the financial markets through credit extension and refinancing operation activities, thus catering to the long-term financing needs of the industrial sector.
The consolidated balance sheet of the AIFIs expanded by 9% during FY15 reflecting moderation from double-digit expansion registered in the previous couple of years. On the assets side, loans and advances continued to be the single largest component, accounting for 87.9% of the total assets and registering a y-o-y growth of 11.3% in the current year. On the liability side, deposits along with bonds and debentures constituted around 65% of total liabilities in FY15. During the year, deposits and borrowings increased by 17% and 9.7% respectively but bonds & debentures registered a decline of 7.2% y-o-y. In FY15, AIFIs raised shortterm funds mainly by floating commercial papers, which are capped under the umbrella limit.
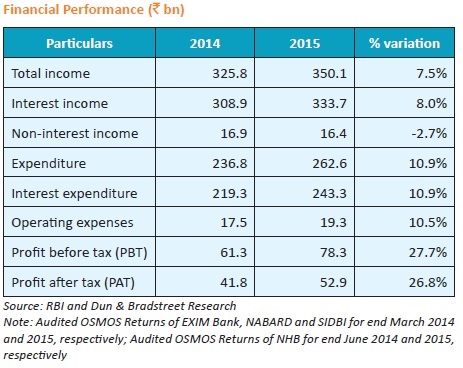
Financial Performance of all India financial institutions
In FY15, total income of AIFIs grew by 7.5% to 350.1
bn and expenditure grew by 10.9% to 262.6 bn. AIFIs
posted modest growth in income owing to low growth in
interest income and decline in non-interest income even
while income from bill discounting/ rediscounting shrunk
substantially. However, AIFIs fared better on the profitability
front as both their operating profit and net profit increased
significantly during the year. Net profit and operating profit
of AIFIs grew 26.8% and 27.7% to 52.9 bn and 78.3 bn
respectively.
Net profit as a ratio to total income remained in double digits and increased marginally from last years level of 12.8% to 15.1% in FY15.
AIFIs maintained capital in excess of minimum stipulated norm of 9%
Presently, FIs are required to have minimum Capital Adequacy Ratio (CRAR) of 9% as against 15% in case of NBFCs. AIFIs maintained capital in excess of the stipulated norm and their capital adequacy position comparatively improved during the year. As on Mar 31 2015, CRAR of AIFIs improved to 18.7% from 17.8% as on Mar 31 2014.
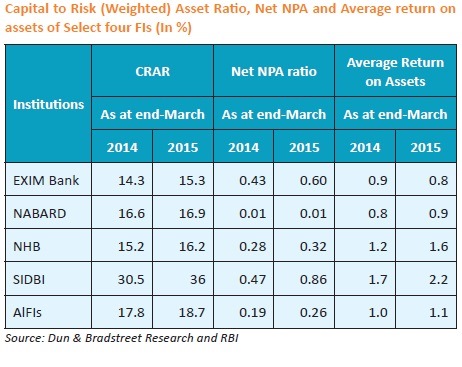
Overall, the FIs enjoyed higher returns on their assets during the year barring EXIM Bank whose return on assets was marginally lower. In FY15, average return on assets of AIFIs grew to 1.1% from 1% in FY14.
The asset quality of AIFIs deteriorated marginally and net NPA as percentage of net loans increased from 0.19% in FY14 to 0.26% in FY15. Nevertheless, the stressed asset position of these four FIs remained comparatively better than that of the commercial banks and other NBFCs. Net NPA as a percentage of net loans and advances is highest for SIDBI followed by EXIM Bank, NHB and NABARD.