 |
India's Top 500 Companies 2016 |
|
||||||||||||||||||||||||||||||||||||||||||||||||||||||||||||||||||||||||||||||||||||||||||||||||
|
|||||||||||||||||||||||||||||||||||||||||||||||||||||||||||||||||||||||||||||||||||||||||||||||||||||||||||||||
This section includes the key analytical observations and trends of Dun & Bradstreets Indias Top 500 Companies. These insights are derived from the comparison of financial performance during FY15 and FY14 of the Top 500 companies in India which have featured in current edition of publication. The publication features companies listed on the BSE and/or NSE, which are categorised on the following parameters for analytical purposes:
Ownership/Market Cap-wise share of companies in Top 500
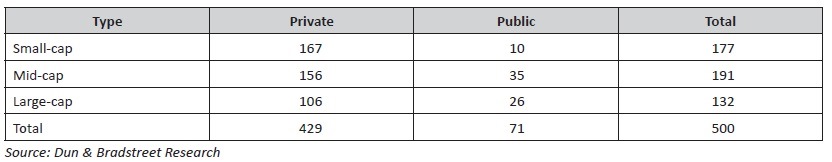
The Top 500 companies comprise of 132 large-cap companies with average market capitalisation of ` 119.2 bn or more; 191 mid-cap companies having average market capitalisation between ` 116.9 bn and ` 21.5 bn; 177 small-cap companies with average market capitalisation below ` 21.5 bn.
The 2016 edition of Indias Top 500 companies witnessed the debut of 37 new companies as compared to 51 new companies in the last edition. These debutant companies are across various sectors. Majority of the new entrants belong to the following sectors including; textiles (6 nos) and auto components (3 nos). Among the 37 new entrants, one is a large-cap company while 14 are mid-cap companies and 22 belong to the small-cap category.
During FY15, these 37 new entrants outperformed Top 500 companies in terms of total income and net profit growth. During FY15, the total income of these debutants grew by 8.1% while their net profit declined by 7.4%, as against the overall Top 500 companies which witnessed an income growth of 2.8% and profit growth of 4.6% during FY15. Indian total exports increased marginally by 0.2% during FY15 on the back of global economic slowdown. Pressure exerted by the subdued global economic activity also dented the export performance of all the featured Top 500 companies. Export revenue of all the featured Top 500 companies declined marginally by 5.4% during FY15 as compared to the growth of 15.7% during FY14. Export revenue of new entrants on the other hand grew marginally by 2.9% during FY15 as compared to the growth of nearly 43% during the last year.
Top 500 companies clock a growth of 18% in their Average Market Capitalisation in the 2016 edition
In the 2016 edition, the average market capitalization of Top 500 companies stood at ` 89,967.7 bn as compared to ` 76,173.4 bn during the same period last year, registering a growth of over 18%. In addition, approximately 121 companies witnessed a drop in their average market cap. These 121 companies lost nearly ` 2,912.0 bn in their average market cap during FY15. The remaining 379 companies gained nearly ` 16,705.3 bn in their average market cap during FY15.
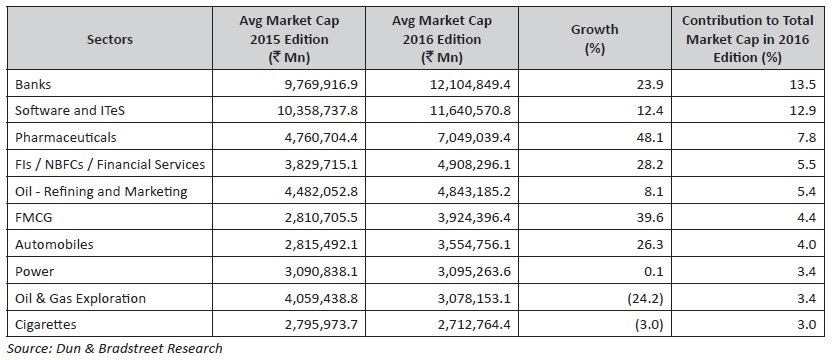
The top 10 sectors, mentioned in the table below, contributed to more than 63% to the total average market cap of all 500 companies. Of the top 10 sectors, top five sectors accounted for over 45% of the total market cap. Banks and Software & ITeS emerged as the highest contributors with 13.5% and 12.9% share respectively in the total market cap.
Top 10 Sectoral Contributors to Average Market Cap of Top 500 companies
Despite the positive economic indicators, Top 500 companies witness moderation in income and profit growth
Gross Domestic Product (GDP) growth which had plummeted to sub 5% levels in the past two fiscal years, bounced back on macro-economic stability, reforms introduced, and a strong mandate of current government to introduce decisive economic change. The growth in real GVA at basic prices, though not spectacular, has moved comfortably to 7.1% in FY15 compared to 6.6% in FY14. The macroeconomic improvement and consequent turnaround in the investor sentiments were spurred by governments policy actions on environmental clearances; mining licenses and a thrust to restart the stalled projects.
Inflation rate and inflationary pressures reduced beyond the target set by the Reserve Bank of India (RBI) due to decline in international commodity prices, especially the crude oil prices. This led to initiation of the monetary policy easing the cycle from the last quarter of FY15. Despite these positive economic indicators, Indias leading corporates faced a severe stress on their earnings and profitability. The decline in aggregate corporate performance can be attributed to a number of reasons including corrections in commodity prices, global deflation of manufactured products coupled with surplus capacity in the domestic market, falling domestic (industrial and consumer) and global demand.
Consequently, total Income (TI) of the Top 500 companies slowed down to 2.8% in FY15, compared to 9.9% in FY14. The Profit after Tax (PAT) of the Top 500 companies grew by 4.6% in FY15 compared to 3.2% in FY14, indicating the nearly flat growth in profitability of the Top 500 companies during FY15. Further, the number of loss making companies increased from 32 in FY14 to 39 in FY15, indicating the deterioration in the performance of corporate India amidst volatility in the external environment.
The top 10 sectors, which contribute significantly to the income, include automobiles, banking, oil refining & marketing, software & ITeS, power, iron and steel, FIs/NBFCs/financial services, telecom services, oil & gas exploration, gas processing, transmission & marketing, accounting for almost 69% of aggregate income of Top 500 companies.
Income-wise Top 10 contributing sectors (FY15)

From among the top 10 contributing sectors, the sectors having witnessed a slowdown in their income growth during FY15 include oil refining & marketing and oil & gas exploration. The total income from the oil refining & marketing sector declined by 9.3% while that of oil & gas exploration sector declined by 4.6% in FY15 as compared to FY14. This was mainly due to decline in international oil prices which had a direct impact on the Indian oil - refining & marketing and oil & gas exploration companies.
The slowdown in the overall business sentiments impacted the finance raised by the Top 500 companies during FY15. The total borrowings by the Top 500 companies increased by 8.3% in FY15 compared to a growth of 13.0% in FY14.
Mid-cap companies outperform their peers in terms of income growth while Large-cap companies score in profit growth
During FY15, large-cap companies contributed to over 72% of the total income of the Top 500 companies, followed by mid-cap companies at 19.3%. In terms of y-o-y growth, total income of mid-cap companies grew at a rate of 6.2% in FY15 as compared to the growth of 1.8% and 4.2% witnessed by large-cap and small-cap companies, during the same period. However, in terms of net profit, net profit of large-cap companies grew by 5.4% in FY15 as compared to 4.2% in FY14, while that of mid-cap companies grew by 2% while that of small-cap companies declined further by 11.8%.
Private sector companies score over public sector companies on TI and net profit growth
71 public sector companies which form the part of Indias Top 500 companies in FY15, accounted for a share of more than 40% in the total TI of Top 500 companies as against 431 private sector companies which accounted for almost 60% share in the overall income. The total income growth of public sector companies remained flat in FY15 over FY14 compared to private sector companies whose TI increased by 9.2% in FY15 as compared to FY14.
In case of the public sector companies which are forming the part of the Top 500 2015, net profit declined by 5.7% as compared to private sector companies whose profit grew by 10.7%.
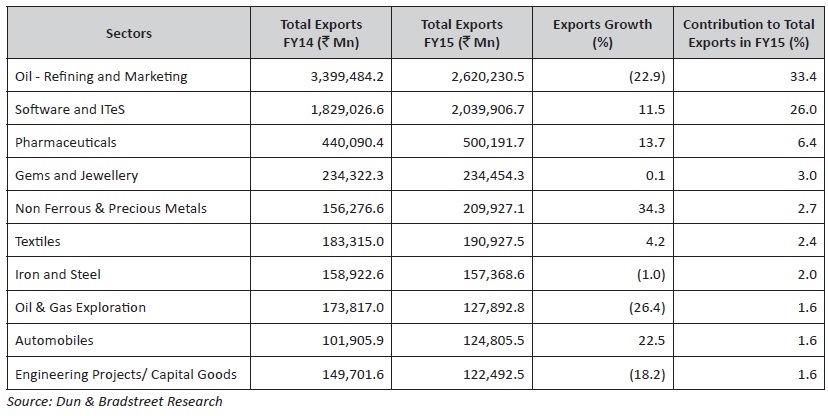
Top 500 companies account for over 27% of Indias total exports
The contribution of total exports of the Indias Top 500 companies (excluding banks and coal & coal product companies) to Indias overall exports declined marginally from 29% in FY14 to 27.4% in FY15. The Top 500 companies also witnessed a slowdown in their exports orders during FY15 on account of global economic slowdown. The export revenue of Top 500 companies declined by 5.4% in FY15 as compared to the growth of 15.7% in the year before.
The Top 10 sectors contributing to exports accounted for more than 80% of the total exports by the Top 500 companies, excluding banks and coal & coal product companies. Of the top 10 sectors, oil-refining & marketing and software & ITeS sectors alone accounted for nearly 69% of the exports by the Top 500 companies. The impact of global economic slowdown on the Top 500 companies can be seen through the export performance of top 10 sectors. Of the top 10 sectors contributing to the exports of Top 500 companies, six sectors witnessed a slowdown or decline in their export revenue during FY15.
Export income-wise Top 10 contributing sectors (FY15)
Moderate profit growth leads to moderation in the dividends paid by Top 500 companies in FY15
Despite the positive economic indicators, Indias leading corporates faced a severe stress on their earnings and profitability, primarily due to corrections in commodity prices, global deflation of manufactured products coupled with surplus capacity in the domestic market, falling domestic and global demand. This resulted in slower income and profit growth of Indias Top 500 companies in FY15 as compared to FY14, thereby impacting the dividends paid by these companies. The aggregate dividend paid the Top 500 companies slowed down from 16.7% in FY14 to 13.2% in FY15.
Top 10 sectors as per dividend paid
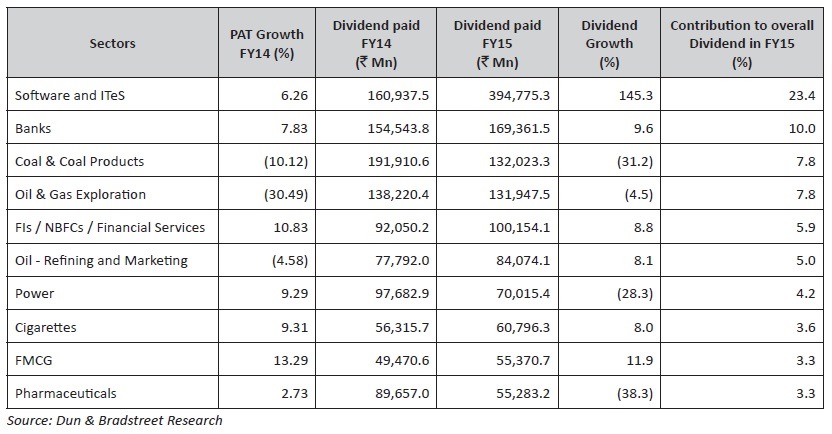
The Top 10 sectors contributing to dividend accounted for nearly 75% of the total dividends paid by the Top 500 companies. Of the Top 10 sectors, software & ITeS, banks, coal & coal products and oil & gas exploration sectors alone accounted for nearly 50% of the dividends paid by the Top 500 companies. Dividend paid by software & ITeS companies grew by over 145% in FY15 as compared to FY14, on back strong financial performance and increased revenue from exports. Banks on the other hand, despite the increase in nonperforming assets, were generous in distributing the earnings amongst their shareholders. The dividend paid by the banking sector grew by nearly 9.6% in FY15. Power sector which faced severe operational stress due to unavailability of coal, distributed less dividend despite the growth in profit. The dividend paid by the power sector declined by nearly 28%.
Public sector companies who witnessed a y-o-y decline in their net profit as compared to their peers in the private sector, paid lower dividends compared to companies in the private sector. The public sector companies accounted for 33% of the total dividend paid by Top 500 companies in FY15, as against 67% share of private sector companies in the total dividends paid.