 |
India's Top 500 Companies 2016 |
|
||||||||||||||||||||||||||||||||||||||||||||||||||||||||||||||||||||||||||||||||||||||||||||||||

|
|||||||||||||||||||||||||||||||||||||||||||||||||||||||||||||||||||||||||||||||||||||||||||||||||||||||||||||||
|
|||||||||||||||||||||||||||||||||||||||||||||||||||||||||||||||||||||||||||||||||||||||||||||||||||||||||||||||
Global Scenario
Global Equity Markets
In 2014, the world economies grew at a modest rate of 3.4% with the 1.8% growth in advanced economies and 4.6% growth in emerging and developing economies. Factors which affected the activities and growth globally in 2014 include global shocks, such as lower oil prices and country- or region-specific factors, such as exchange rate swings triggered by actual and expected changes in monetary policies. Companies across the world are looking for getting listed in more than one market. As the regulatory scenario in emerging economies changes and capital markets become more sophisticated, companies from the developed market will increasingly access capital markets in emerging economies. Asia Pacific region has been increasingly attracting more capital giving competition to developed markets.
Market cap of NSE and BSE grew 9% and 10.1% respectively, almost double the average growth of 5% depicted by the world stock exchanges.
Market capitalization is the market value of all listed corporations on a stock exchange and thus represents the size of an exchange. The total market capitalization of stock markets across the globe reached USD 63.5 tn as on Dec- 14. During the 7 months period of Jan-Jul 2015, market capitalisation of the world stock exchanges has seen further growth to reach level of USD 66.6 tn.
Region-wise, stock exchanges in the Americas dominate over Asia-Pacific and Europe-Africa-Middle East (EAME) regions accounting for 47.6% of total market capitalization of the world stock exchanges. In CY14, market capitalization of stock exchanges in Americas and Asia-Pacific regions grew 7% and 13.8% to US$ 30.26 tn and US$ 21.08 tn respectively. Due to fragile economic conditions in Europe, stock exchanges in EAME region displayed a lackluster in their performance with market capitalization declining 8% to US$ 12.17 tn.
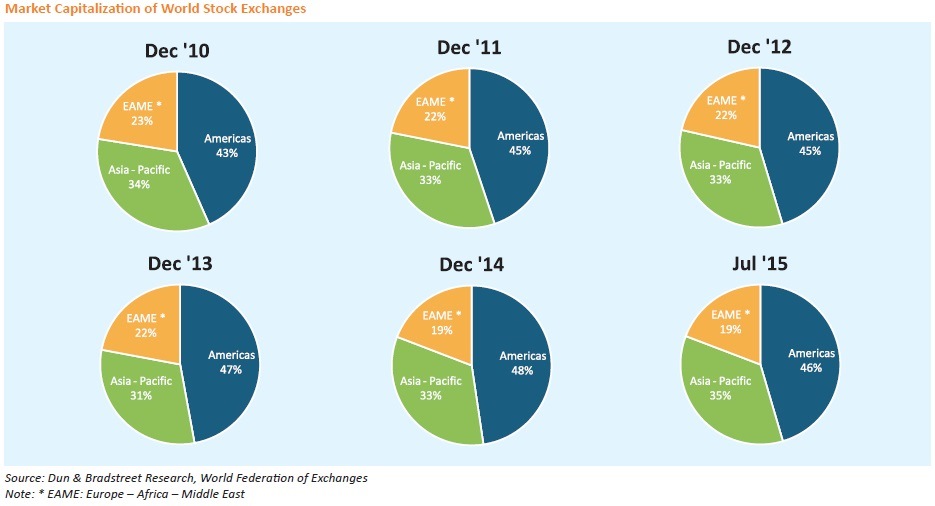
The market capitalization of the countrys leading stock exchanges, Bombay Stock Exchange (BSE) and National Stock Exchange (NSE), which declined 10% in CY13 on account of economic slowdown and huge volatility in Indian currency, displayed a tremendous recovery in CY14 buoyed by the stable government at the centre.
During 7 months period Jan-Jul 2015, market capitalization of BSE and NSE further grew to US$ 1.64 tn and US$ 1.59 tn respectively. The Indian stock exchanges were amongst the best performing exchanges in the world during Jan-Jul 15. During the period, the market cap of NSE and BSE grew 9% and 10.1% respectively, almost double the average growth of 5% depicted by the world stock exchanges. As market capitalisation of Indian stock exchanges have increased considerably during Jan-Jul 2015 this has resulted in the increase in their share in global market to around 5%.
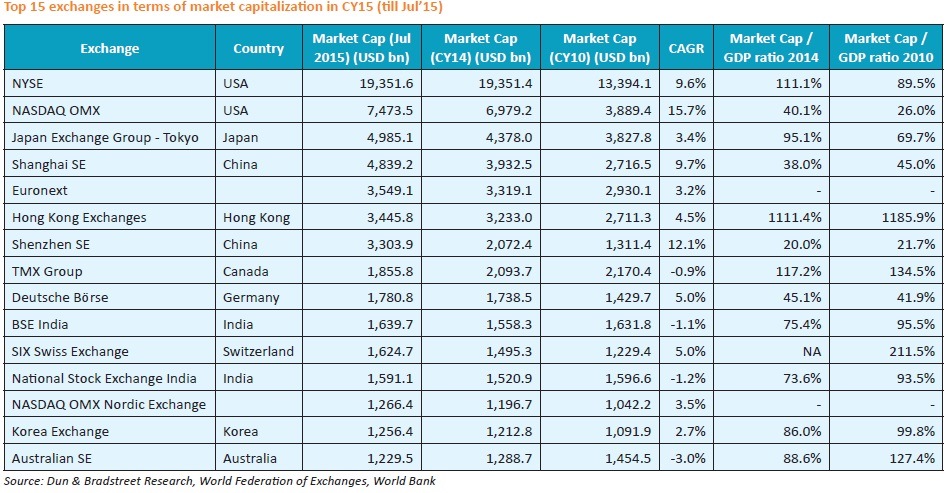
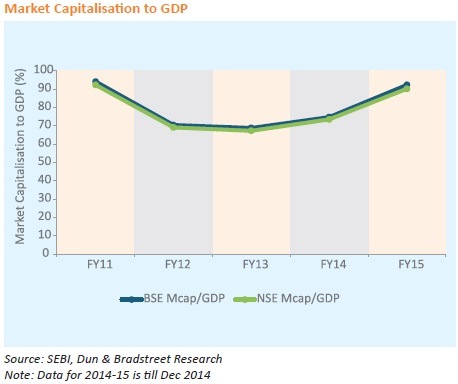
Market capitalization to GDP ratio which provides significant
insights into the liquidity of equity market declined for
both BSE and NSE from 95.5% and 93.5% in CY10 to 75.4%
and 73.6% in CY14 respectively. The decrease in market
capitalization ratio over five years period indicates declining
participation as well as size and liquidity of the Indian capital
market. This is clearly indicated by the decline in FIIs inflows
in the equity market which decreased from  1332.7 bn in
CY10 to 970.5 bn in CY14 registering a four-year CAGR
decline of 7.6%.
1332.7 bn in
CY10 to 970.5 bn in CY14 registering a four-year CAGR
decline of 7.6%.
Indian stock exchanges which are globally ranked higher in trade volume, accounted for 14% of the total trade volumes of the total trade volumes of the world stock exchanges
The Indian stock exchanges are the leading exchanges in the world in terms of number of trades in equity shares and number of contracts traded in derivative segment, especially in stock index option. In fact, NSE tops the list with highest number of stock index options traded during Jan Jul 2015. Indian stock exchanges together accounted for around 14% of the total trade volumes of the world stock exchanges. In CY14, number of shares traded at BSE and NSE stood at 387 mn and 1.7 bn respectively registering a y-o-y growth of 12.3% and 17.7% respectively.
During the 7 month period of Jan-Jul 2015, the total trades of world stock exchanges recorded a splendid growth rising 77.4% to 14.2 bn compared with 7 month period of Jan-Jul 2014. The Indian stock exchange continued to rank higher in trade volumes compared with its peer exchanges. The number of trades at NSE stood at 1.1 bn while EOB trades in BSE stood at 227 mn during the 7 month period of Jan- Jul 2015.
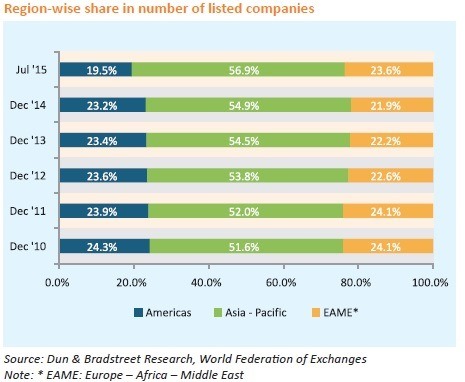
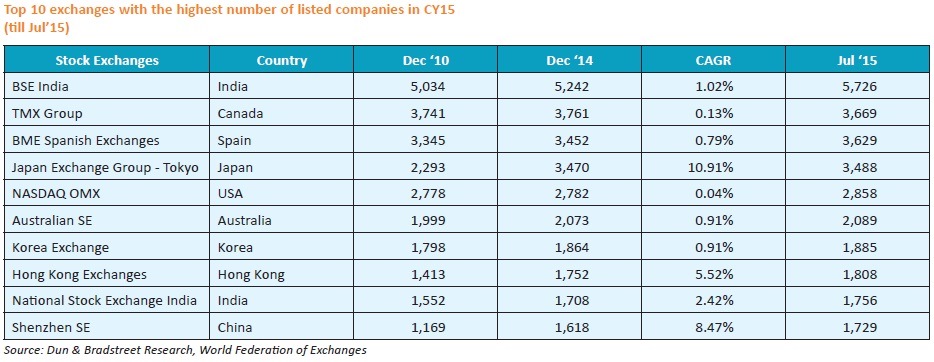
Despite global slowdown, Asia Pacific Region continues to see higher number of listings; BSE and NSE ranked amongst the top 10 exchanges with the highest number of listed companies
Asia-Pacific continues to have highest number of listed companies amongst all the regions. In past few years, share of Asia-Pacific has increased while share of other regions (Americas and EAME) declined marginally.
As on Jul 2015, the companies listed on world stock exchanges decline 3.3% to 43,026 companies mainly on account of decrease in the companies listed on stock exchanges in Americas. The companies listed on stock exchanges in Americas decreased drastically by 19% to 8,375 companies as on Jul 2015. Asia-Pacific and EAME regions showed marginal growth of 0.3% and 4.2% respectively in the number of listed companies as on Jul 2015.
The Indian stock exchanges are lower in world ranking in terms of trading value despite having the highest number of listed companies and amongst the largest investor base in India. Over the past few years, Indian stock market showed positive movement in the number of listed companies. Indias stock exchanges are amongst the top 10 exchanges across the globe with BSE topping the list. As on Jul 2015, BSE recorded the highest number of listed companies (5,726) followed by the TMX Group (3,669). National Stock Exchange of India ranked 9th across the globe in terms of number of listed companies as on Jul 2015 with 1756 listed companies.
Indian Scenario
Key Economic Indicators
‒ GDP at constant prices (2011-12) grew at 7.3% in FY15
to 106.4 trillion (PE)
‒ GVA at basic price at constant 2011-12 prices)grew by 7.2% in FY15
‒ Between Mar-14 to Aug -15, RBI reduced repo rates twice by 0.75 bps to 7.25%
‒ IIP vastly improved to 2.8% in FY15 as compared to -0.1% in FY14
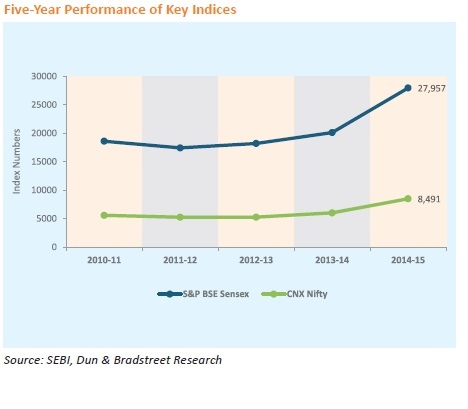
‒ BSE Sensex closed at 27,957 points on 31st March 2015, nearly 25% higher than a year ago
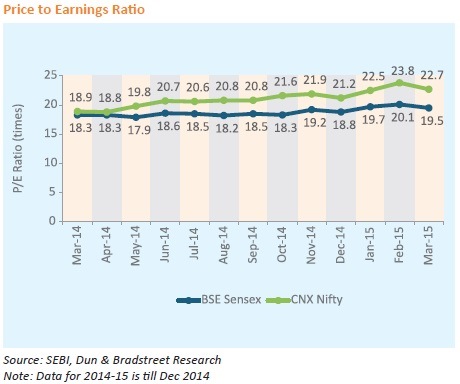
‒ The aggregate P/E ratio of the BSE improved from 18.3 times in Mar 2014 to 19.5 times in Mar 2015
Current Scenario of Indian Securities Market
The formation of the new government at the Centre in May 2014 brought about a renewed hope for a revival in the domestic economic scenario through reforms and policies. The new government ushered in changes to attract foreign investment, like curbing the use of retrospective taxation and raising the FDI cap on sectors like insurance and defence. Measures to ease governance norms and setting up of FPI regulation aimed at improving the operations of both primary and secondary market also augured well for the domestic markets. The equity market was also supported by global liquidity conditions, lower international crude oil prices and softening of the policy rate. Accordingly, the BSE Sensex crossed the 27,000 mark; while the CNX Nifty breached the 8,400 levels.
I. Primary Market Trends
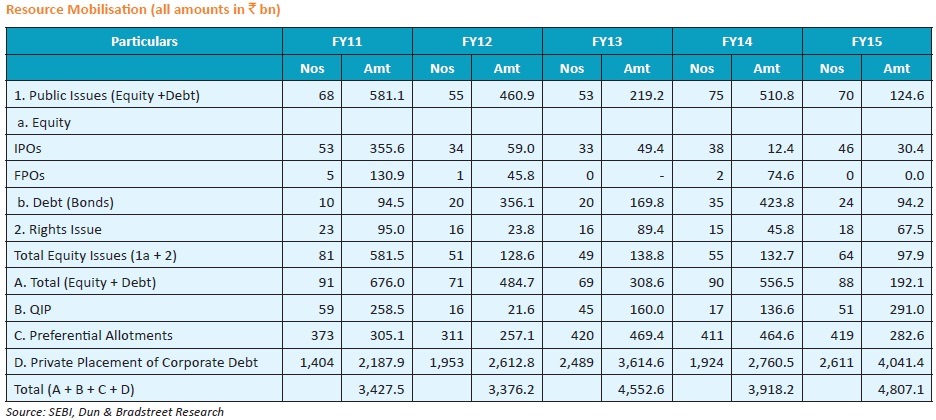
Private placement spurs 22.7% rise in overall resource mobilisation
The cumulative value of overall resource mobilisation by
the corporate sector in FY15 stood at 4,807.1 bn, about
22.7% higher than a year ago. This rise was driven by a steep
46.4% rise in resources mobilised via private placement of
corporate debt. As per data furnished by SEBI and the RBI,
about 4,041.4 bn was raised by Indian companies through
this route, which was the highest ever fund raised thus in
a financial year. These funds have been raised mainly for
expansion of business plans and to support working capital
requirements. Financial institutions or banks contributed to
most of the fund-raising.
QIPs remained robust and rocketed to a five-year high in
FY15. Companies raised 291 bn via 51 QIP issues in FY15,
more than twice the funds raised in FY14 ( 136.6 bn).
Resource mobilisation through public issues plunges 65.5% in FY15
In contrast, other segments of the primary markets were
relatively subdued in FY15. Cumulative resource mobilisation
in equities during the year stood at 97.9 bn from 64 issues,
about 26.2% lower than the 132.8 bn raised via 55 issues
in FY14. Resource mobilisation via the public issues route
(equity + debt), reflected a sharp decline of 65.5% in FY15,
with only 192.1 bn being raised as against 556.5 bn in
FY14.
Out of the 64 companies that accessed the primary market
for equity in FY15, about 46 took the public issue route,
while the other 18 opted for rights issues. The number of
IPOs in FY15 was 46, as against 38 in FY14. Although largeticket
IPOs were missing through the year, a total of 30.4
bn were raised through this route. On the other hand, while
companies raised 74.6 bn via FPOs in FY14, nothing was
raised in FY15. Funds raised via debt issues declined from
423.8 bn in FY14 to a much lower 94.2 bn in FY15.
Funds raised via preferential allotments also declined steeply
in FY15. They stood at 282.6 bn in FY15 as against 464.6
bn raised in the preceding year, which translates into a sharp
39.2% decline.
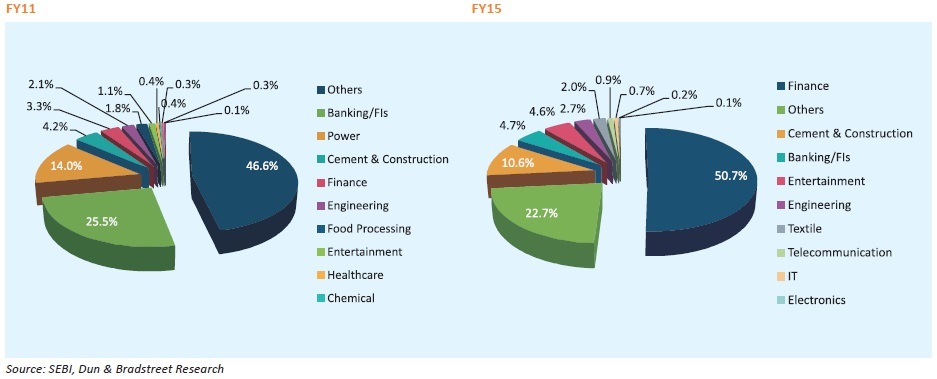
Industry-wise classification for FY15 recorded that the finance sector had a lions share in overall resource mobilisation for equities. Around 30 issues of financing companies from the industry contributed to nearly 51% to the total resource mobilisation. The cement & construction sector accounted for about 11% of the total fund raised, signifying efforts made by the sector to overcome its cash crunch. On the other hand, the share of banks/FIs in capital raised declined from as much as 25.5% in FY11 to merely 4.7% in FY15.
Industry-Wise Share in Capital Raised
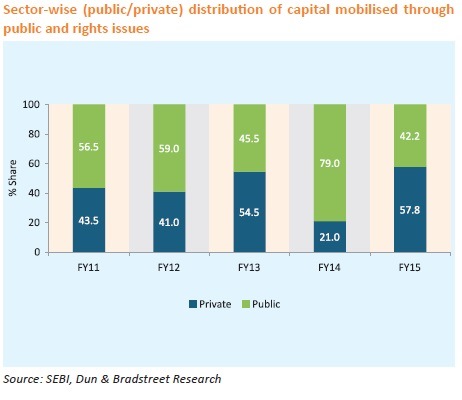
With respect to sector-wise (public sector & private sector)
distribution of capital raised through public and right issues,
private sector companies were found to have raised more
capital in FY15 as compared to public sector companies. Of
the 192.1 bn raised via public and rights issues in FY15,
about 57.8% ( 11.1 bn) were raised by private sector
companies. This was in sharp contrast to FY14, when public sector companies accounted for a whopping 79% of the
total capital raised.
II. Secondary Market Trends
The Indian securities markets saw new highs in FY15, with
benchmark indices peaking to new levels. The Indian capital
markets witnessed a rebound in FY15, with the BSE Sensex
closing at 27,957 points on 31st March 2015, nearly 25%
higher than a year ago. Likewise, the market capitalisation
on the BSE as on 31st March 2015 stood at 101.5 trillion,
about 36.9% higher than on 31st March 2014.
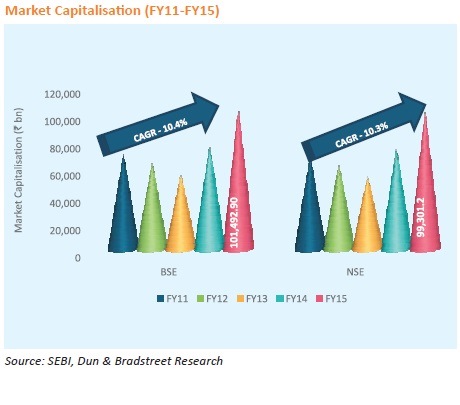
The aggregate market capitalisation of the two major stock exchanges in the country, the BSE and the NSE, grew at a CAGR of more than 10% between FY11 and FY15. On a y-o-y basis, both exchanges registered more than 35% growth. The market capitalisation-to-GDP ratio monitors the growth and development of the stock market in tandem with the economy. By Dec 2014, the market capitalisation-to-GDP ratio of both, the BSE as well as the NSE, had reached 90% levels, which was previously witnessed in FY11. On a y-o-y basis, the ratio has improved from 74.7% and 73.4% in FY14 for BSE and NSE, respectively.
The price-to-earnings ratio, which is an indicator of the valuation of the shares, experienced a bounce-back by the end of Mar 2015. Compared to Mar 2014, the aggregate P/E ratio of the BSE Sensex and the CNX Nifty improved from 18.3 times and 18.9 times, respectively, in Mar 2014 to 19.5 times and 22.7 times, respectively, in Mar 2015.
III. Derivatives Market Segment
Over the years, the popularity of the Indian derivatives market has grown by leaps and bounds. It has registered manifold increase in volumes, in terms of number of contracts traded, traded value, and the products traded. The turnover in the derivatives market is extensively higher and has surpassed the cash segment.
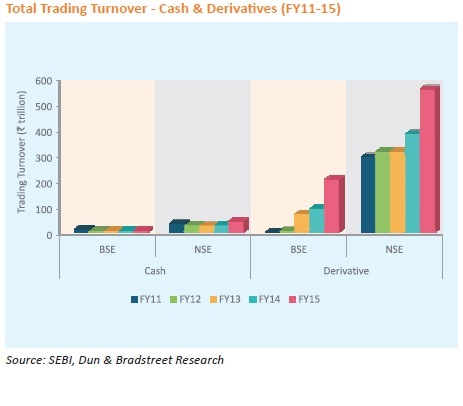
The total turnover (cash and derivatives) on the BSE has
increased multi-fold, from merely 11.1 trillion in FY11 to
212.2 trillion by 31st March 2015. This reflects a
stupendous growth rate of 109.3% per annum. Over the
same period, the turnover on the NSE increased from
328.3 trillion in FY11 to a huge 599.4 trillion by 31st
March 2015, at a CAGR of 16.2%. This growth is exclusively
due to the derivatives segment.
Trading turnover from derivatives segment at 759.7
trillion in FY15
The aggregate trading turnover of the cash segment on both
exchanges taken together remained largely unchanged during
FY11-15, having increased marginally from 46.8 trillion in
FY11 to 51.8 trillion in FY15. On the other hand, trading in
the derivatives segment has seen a manifold growth over the
last five years. The aggregate trading turnover (derivatives)
on both exchanges taken together grew from 292.5 trillion
in FY11 to 759.7 trillion in FY15. Even in terms of number
of contracts, the derivatives market has shown tremendous
growth. While the NSE recorded 1 bn derivatives contracts
in FY11, there were about 1.84 bn derivatives contracts in
FY15. The growth was more remarkable on the BSE, with the
number of derivatives contracts rising from merely 5,623 in
FY11 to 505.5 mn in FY15.
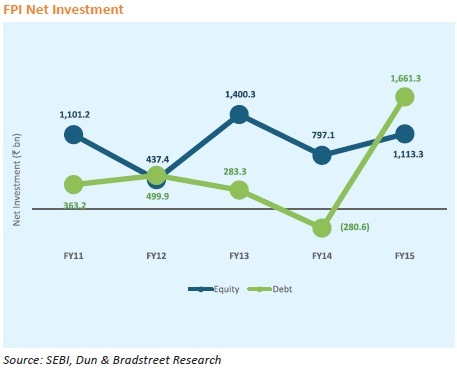
IV. Net Investments
With effect from June 2014, under the Foreign Portfolio Investor (FPI) Regime, the erstwhile FIIs, sub accounts and QFIs were merged into a new investor class termed as Foreign Portfolio Investors (FPIs). FPIs in the equity and debt markets in India revived during 2014-15. Investments in debt surpassed equities and retained a share of about 60% in overall FPI investments.
FPI inflows rise sharply in FY15
FPI inflows to the debt market turned positive in FY15 at
1.6 trillion, as against a net outflow of 280.6 bn in FY14.
This was largely due to an increase in the FPI sub-limit by USD
5 bn within the overall limit of USD 30 bn. FPI investments
in the equity markets also reflected a rise in FY15, growing
by a handsome 39.7% as compared to FY14 to 1.1 bn.
Currently, FPI investors are permitted to invest only in bonds
with the minimum residual maturity of three years, so as to
encourage investments in long term securities and to contain
interest rate volatility.
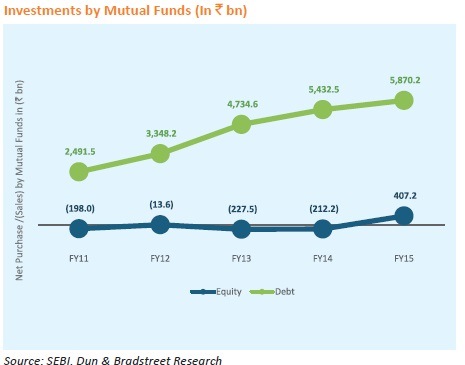
Mutual funds pump in 407.2 bn in equity markets in
FY15
Mutual funds play an important role in channelizing
household savings in capital markets. In FY15, mutual
funds recorded a net investment of 407.2 bn in the equity
markets. This was the first time since FY09 where mutual
funds had recorded a net purchase in the equity markets,
indicating a return to confidence in the markets. In FY09,
mutual funds had a net purchase of 69.9 bn in the equity
markets.
Between FY11 and FY15, the quantum of transactions by
mutual funds on stock exchanges, in terms of net purchase/
sales of both equity as well as debt, grew at the rate of 28.6%
per annum. In FY15, mutual funds executed net purchases/
sales (equity + debt) to the tune of 6,277.4 bn. This
translates into a 20.3% rise over the preceding year.
In FY15, mutual funds net purchase in debt grew by 8.1%
y-o-y to 5,870.2 bn. During the year, debt accounted for
93.5% of the aggregate net investment of mutual funds in
the stock exchanges.
The Assets under Management (AUM) of mutual funds,
across schemes, registered an upward trend in FY15. It
increased by 31.2% to 10.8 trillion in FY15, from 8.2
trillion in FY14.
Household Savings A major growth driver
The new government aims at directing USD 100 bn of household savings into capital markets by the end of its term. Household savings are a crucial untapped opportunity for the economy. Despite several efforts in the past to encourage households investments in the stock markets, the share of equities in household savings has been eroding. As per RBI, during 2014, the share of household savings in shares and debentures hardly stood at 3%. The equity culture in Indian households need a push, which includes creating awareness about mutual funds, and Systematic Investment Plans (SIPs) which can be safer options for retail investors, and to wean households over-dependence on investment avenues like gold and real estate.
The Way Ahead
A promising FY15 has helped Indian stock markets attain a top position amongst other global major securities markets. However, after hitting an all-time high, the markets have witnessed some correction in the early few months of FY16. It is crucial for the government to expedite reforms and to retain the attractiveness of the Indian economy in the eyes of foreign investors.
The equity broking fraternity is fully aware of the fact that technology offers endless opportunities to gain a competitive edge by way of developing the scale and scope of business, and at reasonable costs. Investing in IT and back-office infrastructure can help broking houses improve efficiencies, reduce latency, and improve the quality and speed of their service delivery. The use of analytical tools can help broking houses enable their clients to make informed and timely investment decisions. Gradually replacing the traditional method of call-and-trade broking with e-broking and mobile trading will reduce the dependence on office spaces and help firms to cater to more clients in a given time frame. Equity broking houses will need to invest more in technology and digital initiatives to match pace with the current times and to stay relevant to the modern investor.